What's That House Worth?
About this time last year we were bidding on our first house. We didn't want to overbid and thanks to Zoopla I was able do some quick regression analysis to get the insight I needed to bid with confidence. The chart below shows an indexed trend for the general area we were looking at. It also shows observed house sale prices on the streets we liked for the last 12 years (yes, Zoopla provide that data for free!)
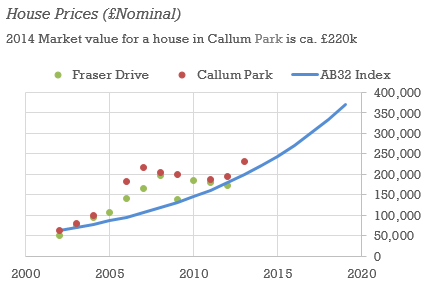
The chart above told me four things:
- The general trend for the area has been strong
- Sale prices for houses in these particular streets (Callum Park and Fraser Drive) have generally been better than the area
- In May 2014 (the current date at the time of this analysis) about £220k is 'on-trend' for a house in Callum Park
- Provided the 12-year trend holds for the next 5 years, I can expect to get a decent return if selling at that time
My 4-step Excel house prices process
Here is how I did the analysis and put this chart together--again, thanks to Zoopla which is a fantastic resource. Download my Excel house price analysis file as a reference.
1. Get historical average price data for the area
This kind of trend for 5 years is readily obtainable from Zoopla here. Rightmove and the BBC also provide a degree of trend information with a longer history. You want to target the town, suburb or city-segment (e.g. EH1, SE8, etc.) but make sure it is not too big an area (e.g. 'Newcastle' would be too big).
2. Get a trend line you are OK with
In my case I looked at the AB32 average price trend on Zoopla/Rightmove and saw it was a fairly consistent 11% year-on-year increase over the last 12 years to 2014. I read some BBC and local news articles on property and economic trends in the area to make assumptions about whether the past trend would continue, and I assumed that it would. You can use a linear trend line or other type of line to predict overall value growth that goes out as far as the time you plan to sell the property (for me, it was 5yrs--2019). You do this to gauge how much you expect the house will be worth at that time, based on past data and the general sense of how that trend will continue. For me, I saw strong growth in the oil price as well as substantial construction work with multi-national companies building offices near the area. This helped me assume the trend would hold up for the next 5yrs. For more on building a trend see this article .
3. Plot actual observed sales for your street
This next step is easy. Use Zoopla to find all the sales on your street for the past 10yrs or so (example here ) then plot them on the chart (in the case of multiple sales in a year you could take the average price for that year). Note: if you cut and paste from Zoopla's website you will have to tidy up the output a bit to get the values you need into Excel. Once you have your trend line and observed sales on the street, base your trend line to the earliest observed sale in the street of interest so you can see the area trend on your street. You may have to write a short formula to convert the trend to a series of year-on-year percent changes to do this. In my case the trend starts with the Callum Park sale for £63k in 2002 (see screen shot below).

After re-basing your trend the result looks something like my chart below (see Excel download here for more detail).
4. Bid with confidence
Now that you have done your own market research on the street where the desired house is located you can better gauge:
- Whether the price you will bid is over-inflated (due to a property market price bubble)
- Whether you can expect to hold the value you pay if re-selling the house in 5-10yrs
One other factor worth being aware of when doing this analysis is that the relative condition of the house should play a part. If we assume houses generally sell in decent condition, a house requiring considerable renovation/DIY work should really be priced below the trend line.