Excel Seasonal Forecasting Technique
Dealing with Awkward Actuals
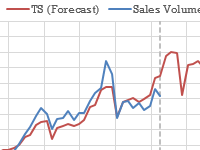
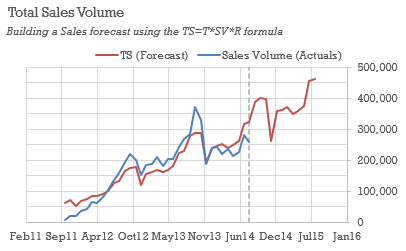
About a year ago I was using a creative excel forecasting technique to send a forecast to the finance team based on a couple of years' worth of data. The historical sales data were difficult to base a sales forecast on for various reasons. I used a formula (taken from CIMA) to produce the following forecast:
Factors that made my historical data hard to extrapolate into a forecast trend were:
- Rapidly increasing volumes generally
- Seasonal swings in sales (e.g. winter peaks)
- Evidence of promotional events causing random spikes in the past trend
The formula for getting around this is actually pretty basic:
TS=T*SV*R
TS=the time series sales forecast you're aiming for
T=a linear trend (or curvilinear if you wish)
SV=seasonal variance
R=random component
4 Steps for a Better Excel Forecasting Technique
Get my 4-step Excel solution download here.
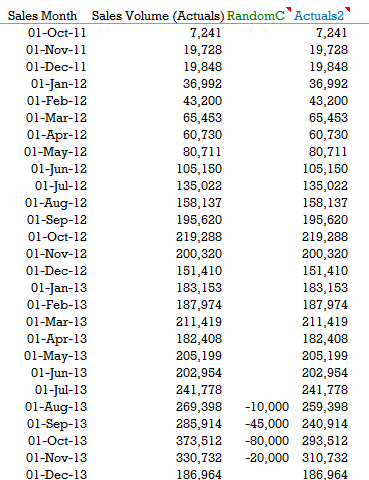
1. Take random known events out of your actuals to get an adjusted actuals series: A
When deriving a trend line as we will do in step 2 you don't want to include random events such as an operational decision to layoff half the sales force, or 'the stock market crash', etc. So you need to apply historic knowledge of known factors to cut out these impacts.
2. Get a trend line: T
You can use an Excel chart, the LINEST() function or another method to derive an equation that relates time to sales (e.g. Sales=4*year+2000). To do this use your adjusted trend from step one as your baseline data. That is an important part of this Excel forecasting technique.
3. Find the seasonal variance multiplier: SV
If your trend has any seasonality in it-i.e. movies in autumn, retail energy in winter, etc. then you need to account for that by using a multiplier for each month in your forecast. To do this find the average variance to trend for historical periods-in my case I did it by month using a well placed pivot table, getting the average of A/T (Adjusted Actuals/Trend). Ensure your A/T's sum up to the number of periods in all 'seasons', so in my case 12 (see solution download).
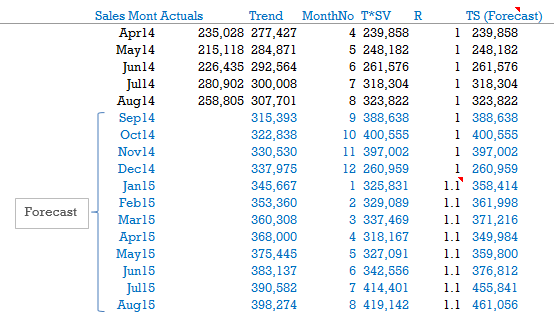
4. Create the Time Series, adding the random component (R) if necessary
Add any known random component factors (e.g. upcoming promotions, economic factors, etc.) then combine it all together by applying the formula TS=T*SV*R.

This technique applies to any time series forecast, provided there is some correlation between actuals and your trend line. As noted by Entrepreneur you don't need to use advanced mathematical techniques for useful forecasting, so hopefully this should be sufficient for most commercial applications. To see my 4-step application of the technique download my workbook.