Extracting Scryfall Magic the Gathering Data: 2 (Python)
Jump to Code/Solution
If you want to skip the below article and go straight to the Jupyter notebook (that does a pretty good job of explaining the below anyway) then feel free do so by clicking on this link: scryfall api notebook.
Progress Since the Previous Article
Well, if you followed the previous article you will now be familiar with the Scryfall API--familiar enough to start pulling some data out of it anyway. And if you spend more time looking at all the available fields and reading through the documentation on their website, more credit and power to you.
After I learned to pull the data out my next interest was to see if I could use the data to track prices, as well as cards I own, to help me identify good buy/sell opportunities. The Jupyter notebook that accompanies this article provides all the code (the files that the code partially depends on--a csv file and a 'cache' folder) are in the wider github repo; and the notebook also provides some explanation on what the code is doing... That last fact actually renders this article more of an abstract than a proper article; but I'll hopefully be able to provide a bit of background and insight to set it up for you.
Arbitrage Opportunities
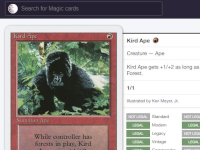
So, after extracting our data on any given day, we get a list of cards along with their dollar market price (usually cardkingdom) and the cardmarket trend price in euro. The first thing I do in the jupyter notebook is add some formulas to check if there is any arbitrage opportunity--that is, if there is scope to buy on cardmarket then sell to cardkingdom. It turns out there are some, even after knocking half the USD price off since I assume you'll only get buylist prices when selling. Once you factor shipping into the formula there are still some options; but not many.
Price Trend Movements
After you run this code several times, for example, once a day/week for several days/weeks, you will see a bunch of csv files accumulating in the cache folder. So what you are doing is gathering data that can be used to analyse prices of cards as a time series. You can then analyse this data--for every single print of the cards you extracted--and quickly filter it to see which cards are either increasing, decreasing, or staying the same in price over time. My idea was to just watch for early signs that a card is increasing in value and buy it--then hold for two months and sell it again at a profit. So, after joining your csv files together and adding some formulas in the last column you can see what is growing or shrinking in value and make these kind of judgements. Doesn't that sound fun!
Portfolio Monitoring
The last thing my Jupyter notebook does is gets an input file (called portfolio.csv) created by you, with a few columns of data in it (cardname, set, buydate, buyprice). It then ingests this file and matches it against current price data you got from the API, then adds a formula to the resulting dataset to show how much each card in your portfolio.csv file has increased or decreased since the buy date. It then sorts the dataset so you can easily see which cards have increased most in value since their buy date.
I didn't do more with it in the notebook, but this idea can be developed further to create a simulated portfolio of cards. Let's say you like this idea of trading cards for profit, but you're not sure yet. You can start to pull down data and then add a card to portfolio.csv with the price you could have bought it at today. Then over time you can track whether it's price rises or falls. You can do the same the following week, then over time build a simulated portfolio and track its value--and you can gain market insight that way as you see prices aligning with rotations, bannings, innovative decklists, and other metagame dynamics.
There truly is an ocean of knowledge to explore here, if you like that kind of thing and have the time to explore it.