Fiscal Regime Modelling in Excel
What I am going to do is first talk about upstream fiscal modelling as I see it--demonstrating a basic Excel model. Then I will show how my model can be extended to do a crude Monte Carlo Simulation in Excel.
Fiscal Regime Modelling
This is something I did when trying to get to grips with fiscal regime modelling in Oil and Gas. I created this model after carefully working through most of Ken Kasriel's book entitled, take a deep breath... Upstream Petroleum Fiscal and Valuation Modeling in Excel: A Worked Examples Approach. That book is a great resource if you are good with Excel but new to oil and gas economics; and from what I've seen of the oil industry, the approaches to upstream portfolio economics are based mostly on the kind of stuff from that book and what I am doing in this article... mostly in Excel also! It is a crying shame that petroleum economists and planners cannot use SQL, MS Access, or ideally SAS (or similar) but in 2015 they cannot. So that is where Palantir, Merak Peep, and other software vendors come into play--offering tools that enable 'beyond-Excel' analysis and data management solutions.
However, it seems that despite these, Excel is the bread and butter mainstay of upstream modelling, probably since that is where the technical skills base of the modelers/economists exists! In early 2014, I looked at the fiscal terms of Trinidad & Tobago's fiscal regime then ventured to model these terms in a simple Excel model. My goal was to understand how the regime performed from an operator or contractor perspective.
If you open my model file you will see that I have stored all my assumptions or single number inputs to the left of the sheet (see below).
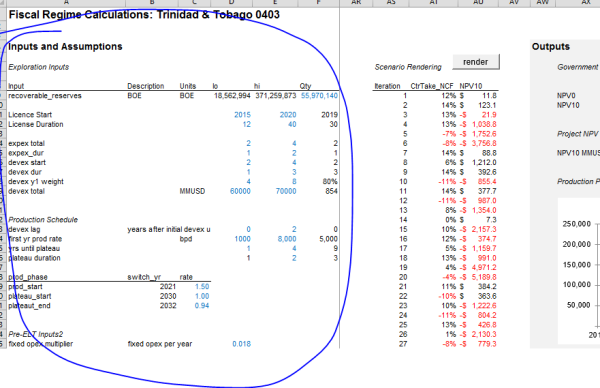
These values then feed my time-series calculations situated toward the middle of the sheet; then to the right I have put all my outputs. I found that to do the calculations, all that is really happening is repeated formulas and calculated columns to derive the variables you require (in my example, the calculations are going from left to right--but Ken Kasriel's book has them going from top to bottom--either way is OK). You start off with production, royalty, gross revenue, and a few other variables--but then the thing grows since you need intermittent formulas to get economic limit, recoverable costs, depreciation, etc.
These upstream model calculations generally follow along a line of calculations/steps in roughly this order:
- Get production forecast rates by product (e.g. oil, gas, ngl, etc.)
- Calculate gross revenue and royalties
- Calculate bonuses
- Calculate the economic limited (pre-tax only!)
- Calculate abandonment and depreciation
- Calculate recoverable costs
- Determine profit oil
- Calculate before tax cashflow
- Calculate taxes and after tax cashflow
- Calculate the present value of after tax cashflows
- Sum these to get the net present value (NPV) of the project
- Create additional variables or calculations if you want to see additional outputs
Monte Carlo Simulation
You should see these 12 steps and the sequence of calculations playing out in the attached model (going from left to right in the sheet)--but I have added a further twist here. Since I wanted to see how the fiscal terms would play out across a range of possible production profiles and cost assumptions I made flagrant use of Excel's RANDBETWEEN function to return random inputs between lower and upper limits for each input variable (e.g. recoverable reserves in place, licence start year, capex outlay, etc.). Every time the sheet recalculates (e.g. by clicking F9) these randomized inputs change and a different production profile and eventual NPV is calculated.
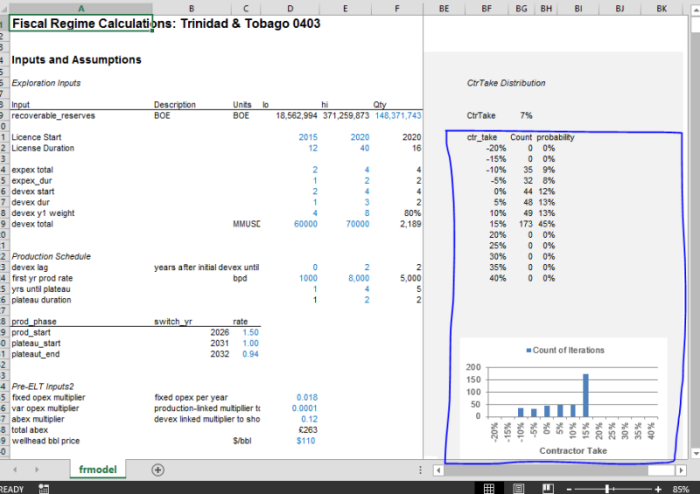
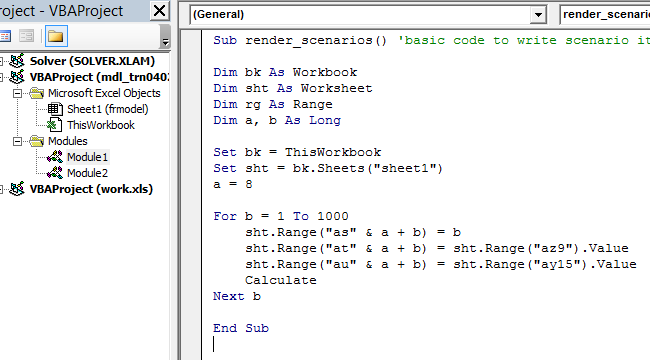
The last thing I did was write a very very short VBA subroutine (see below) to iterate 1000 calculations, each time outputting the results to the region starting in cell AS9 on my model. So what you get is 1000 possible NPV scenarios based on the assumptions made at the outset. The results of these scenarios are in columns BF:BK on my sheet. Currently showing that the company (contractor) will take 15% of profit 45% of the time (the other 85% goes to the government in case you were wondering :) ).
Data Management and Upstream Planning
Although this is the essential basis of upstream economic modelling (and there are some added complexities when it comes to tariff share, abandonment modelling, carry backs and other complexities), additional VBA or other code is required when ring-fence tax calculations, hub dependency modelling, or other multi-project analysis is required.
To do these kinds of thing, data from multiple projects must be combined into consolidated entities for tax calculations, tariff calculation, or contract farm in/out purposes. Managing these kinds of aggregations and their combination with economic calculations while at the same time making the process user-intuitive is the challenge for software developers in this area as at 2015.